Fișier:2021 Worldwide CO2 Emissions (by region, per capita, growth); variwide diagram.png

Mărește rezoluția imaginii (3.000 × 2.000 pixeli, mărime fișier: 718 KB, tip MIME: image/png)
| Acest fișier se află la Wikimedia Commons. Consultați pagina sa descriptivă acolo. |
;_variwide_diagram.png)
Descriere fișier
| Descriere |
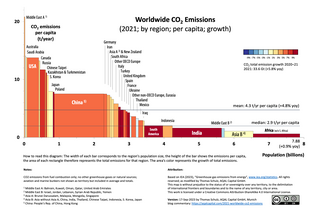
English: The variwide chart allows the visualization of a multitude of data dimensions in one easy-to-read diagram. These data dimensions are:
- Individual country data, such as China, South Africa, or the USA, or a group of countries such as the Middle East, Africa, or Australia/New Zealand, - Population by country or group of countries, - Per capita CO2 emissions, and - CO2 emissions growth year-over-year The total CO2 emissions of a region are represented as a rectangular area. The height of each rectangle is proportional to the CO2 emissions per capita and the width is proportional to the population of the represented region. The regions are sorted by CO2 emissions per capita, from the highest to the lowest. The color of the rectangles indicate their growth rate: “heating up” is represented from light red to dark red, and “cooling down” goes from light blue to dark blue. Based on IEA data from IEA (2023) “Greenhouse gas emissions from energy”, https://www.iea.org/statistics. All rights reserved; as modified by Thomas Schulz, AQAL Capital GmbH. https://aqalcapital.com/2021-worldwide-co2-emissions/ This map is without prejudice to the status of or sovereignty over any territory, to the delimitation of international frontiers and boundaries and to the name of any territory, city or area. License: This work is licensed under a Creative Commons Attribution-ShareAlike 4.0 International License (CC BY-SA 4.0)Deutsch: Das variwide Diagramm erlaubt die Visualisierung von mehreren Datendimensionen in einem einfach zu lesenden Diagramm. Diese Datendimensionen sind:
- Daten der individuellen Länder, wie China, Südamerika, oder die Vereinigten Staaten von Amerika, oder Gruppen von Ländern wie der Mittlere Osten oder Afrika. - Bevölkerung nach Ländern oder Regionen - Pro-Kopf Emissionen, und - Veränderung der CO2 Emissionen zum Vorjahr Die Gesamtemissionen einer Region sind repräsentiert als Rechteckfläche. Die Höhe jedes Rechtecks ist proportional zu den CO2 Emissionen pro Kopf, und die Breite ist proportional zur Bevölkerung der jeweiligen Region. Die Rechtecke sind dann sortiert nach Pro-Kopf Emissionen, von den höchsten zu den niedrigsten. Die Farbe der Flächen indizieren das Wachstum zum Vorjahr: "aufwärmen" ist dargestellt von hellrot zu dunkelrot, und "Abkühlen" von hellblau zu dunkelblau. Basiert auf Daten der IEA data aus IEA (2023) “Greenhouse gas emissions from energy”, https://www.iea.org/statistics. Alle Rechte vorbehalten; wie bearbeitet von Thomas Schulz, AQAL Capital GmbH, München. https://aqalcapital.com/2021-worldwide-co2-emissions/ This map is without prejudice to the status of or sovereignty over any territory, to the delimitation of international frontiers and boundaries and to the name of any territory, city or area. License: This work is licensed under a Creative Commons Attribution-ShareAlike 4.0 International License (CC BY-SA 4.0) |
| Dată | |
| Sursă | Operă proprie |
| Autor | Tom.Schulz |
Licențiere
- Sunteți liber:
- să partajați cu alții – aveți dreptul de a copia, distribui și transmite opera
- să adaptați – aveți dreptul de a adapta opera
- În următoarele condiții:
- atribuind – Trebuie să atribuiți opera corespunzător, introducând o legătură către licență și indicând dacă ați făcut schimbări. Puteți face asta prin orice metodă rezonabilă, dar nu într-un fel care ar sugera faptul că persoana ce a licențiat conținutul v-ar susține sau ar aproba folosirea de către dumneavoastră a operei sale.
- partajând în condiții identice – Dacă modificați, transformați sau creați pe baza acestei opere, trebuie să distribuiți opera rezultată doar sub aceeași licență sau sub o licență similară acesteia.
Istoricul fișierului
Apăsați pe Data și ora pentru a vedea versiunea trimisă atunci.
| Data și ora | Miniatură | Dimensiuni | Utilizator | Comentariu | |
|---|---|---|---|---|---|
| actuală | 26 septembrie 2023 17:32 | | 3.000x2.000 (718 KB) | Tom.schulz | Uploaded own work with UploadWizard |
Utilizarea fișierului
Următoarele pagini conțin această imagine:
Utilizarea globală a fișierului
Următoarele alte proiecte wiki folosesc acest fișier:
- Utilizare la de.wikipedia.org
- Utilizare la en.wikipedia.org
- Utilizare la et.wikipedia.org
;_variwide_diagram.png)