Fișier:Economics Gini coefficient2.svg

Mărimea acestei previzualizări PNG a acestui fișier SVG: 500 × 500 pixeli. Alte rezoluții: 240 × 240 pixeli | 480 × 480 pixeli | 768 × 768 pixeli | 1.024 × 1.024 pixeli | 2.048 × 2.048 pixeli.
Mărește rezoluția imaginii (Fișier SVG, cu dimensiunea nominală de 500 × 500 pixeli, mărime fișier: 2 KB)
| Acest fișier se află la Wikimedia Commons. Consultați pagina sa descriptivă acolo. |
Descriere fișier
| Descriere |
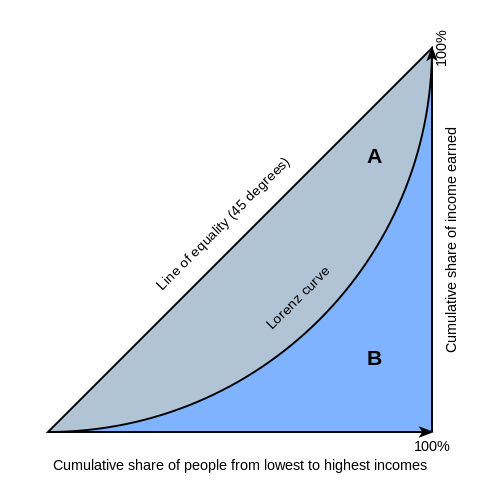
English: Gini coefficient diagram, based on the version by Bluemoose/BenFrantzDale. You can think of the horizontal axis as percent of people and the vertical axis as the percent of income those people receive. Therefore the Lorenz curves always start and end at the same places, where 0% of people make 0% of the country's income and 100% of people make 100% of the total income.
Inequality is implied when the curve is below the 45-degree line: At the left, the percentage of people is higher than the percent of income they receive (i.e. 10% of the people getting 5% of the total income); at the right, the percent of income received rises more than the percent of people receiving it. The area above the Lorenz curve -- marked "A" -- is shaded differently from the area below the curve -- marked "B". This simplifies the mathematical explanation of the gini coefficient, which is A/(A+B) |
| Dată | |
| Sursă | The original file was on WikiMedia Commons (http://en.wikipedia.org/wiki/File:Economics_Gini_coefficient.svg). I have edited the file. |
| Autor | Reidpath |
| Alte versiuni | Creații derivate din acest fișier: Economics Gini coefficient2-ar.svg |
Licențiere
The depicted text is ineligible for copyright and therefore in the public domain because it is not a “literary work” or other protected type in sense of the local copyright law. Facts, data, and unoriginal information which is common property without sufficiently creative authorship in a general typeface or basic handwriting, and simple geometric shapes are not protected by copyright.
This tag does not generally apply to all images of texts. Particular countries can have different legal definition of the “literary work” as the subject of copyright and different courts' interpretation practices. Some countries protect almost every written work, while other countries protect distinctively artistic or scientific texts and databases only. Extent of creativeness, function and length of the text can be relevant. The copyright protection can be limited to the literary form – the included information itself can be excluded from protection.
|
Istoricul fișierului
Apăsați pe Data și ora pentru a vedea versiunea trimisă atunci.
| Data și ora | Miniatură | Dimensiuni | Utilizator | Comentariu | |
|---|---|---|---|---|---|
| actuală | 6 martie 2021 21:00 | | 500x500 (2 KB) | Nyq | decapitalized common nouns |
| 20 martie 2016 19:52 |  | 500x500 (2 KB) | Wylve | Fixed CSS | |
| 20 martie 2016 19:51 |  | 500x500 (2 KB) | Wylve | Reduce tracing artifacts | |
| 24 iunie 2009 18:18 |  | 500x500 (7 KB) | Reidpath | {{Information |Description={{en|1=Gini coefficient diagram, based on the version by Bluemoose/BenFrantzDale. You can think of the horizontal axis as percent of people and the vertical axis as the percent of income those people receive. Therefore the Loren |
Utilizarea fișierului
Următoarele pagini conțin această imagine:
Utilizarea globală a fișierului
Următoarele alte proiecte wiki folosesc acest fișier:
- Utilizare la af.wikipedia.org
- Utilizare la ar.wikipedia.org
- Utilizare la bh.wikipedia.org
- Utilizare la bn.wikipedia.org
- Utilizare la en.wikipedia.org
- Gini coefficient
- Lorenz curve
- Poverty
- Portal:Mathematics/Featured picture archive
- Wikipedia:Reference desk/Archives/Humanities/2010 December 18
- Portal:Mathematics/Featured picture/2012 08
- Wikipedia:Village pump (technical)/Archive 106
- Portal:Mathematics/Selected picture
- Portal:Mathematics/Selected picture/11
- User:Lexsta/sandbox
- Utilizare la et.wikipedia.org
- Utilizare la fa.wikipedia.org
- Utilizare la he.wikipedia.org
- Utilizare la it.wikipedia.org
- Utilizare la ja.wikipedia.org
- Utilizare la km.wikipedia.org
- Utilizare la la.wikipedia.org
- Utilizare la ms.wikipedia.org
- Utilizare la nl.wikipedia.org
- Utilizare la si.wikipedia.org
- Utilizare la sq.wikipedia.org
- Utilizare la sr.wikipedia.org
- Utilizare la te.wikipedia.org
- Utilizare la ur.wikipedia.org